

Session review
The session review captures the real intensity, actual duration and coach notes after a session. It then cross-references this data with player feedback to form the performance loop.
Access the session review
Section titled “Access the session review”Two paths:
- From the calendar: click on a past event → See session review → link at the top of the panel.
- From the menu: Session results in the sidebar navigation.
Session results page
Section titled “Session results page”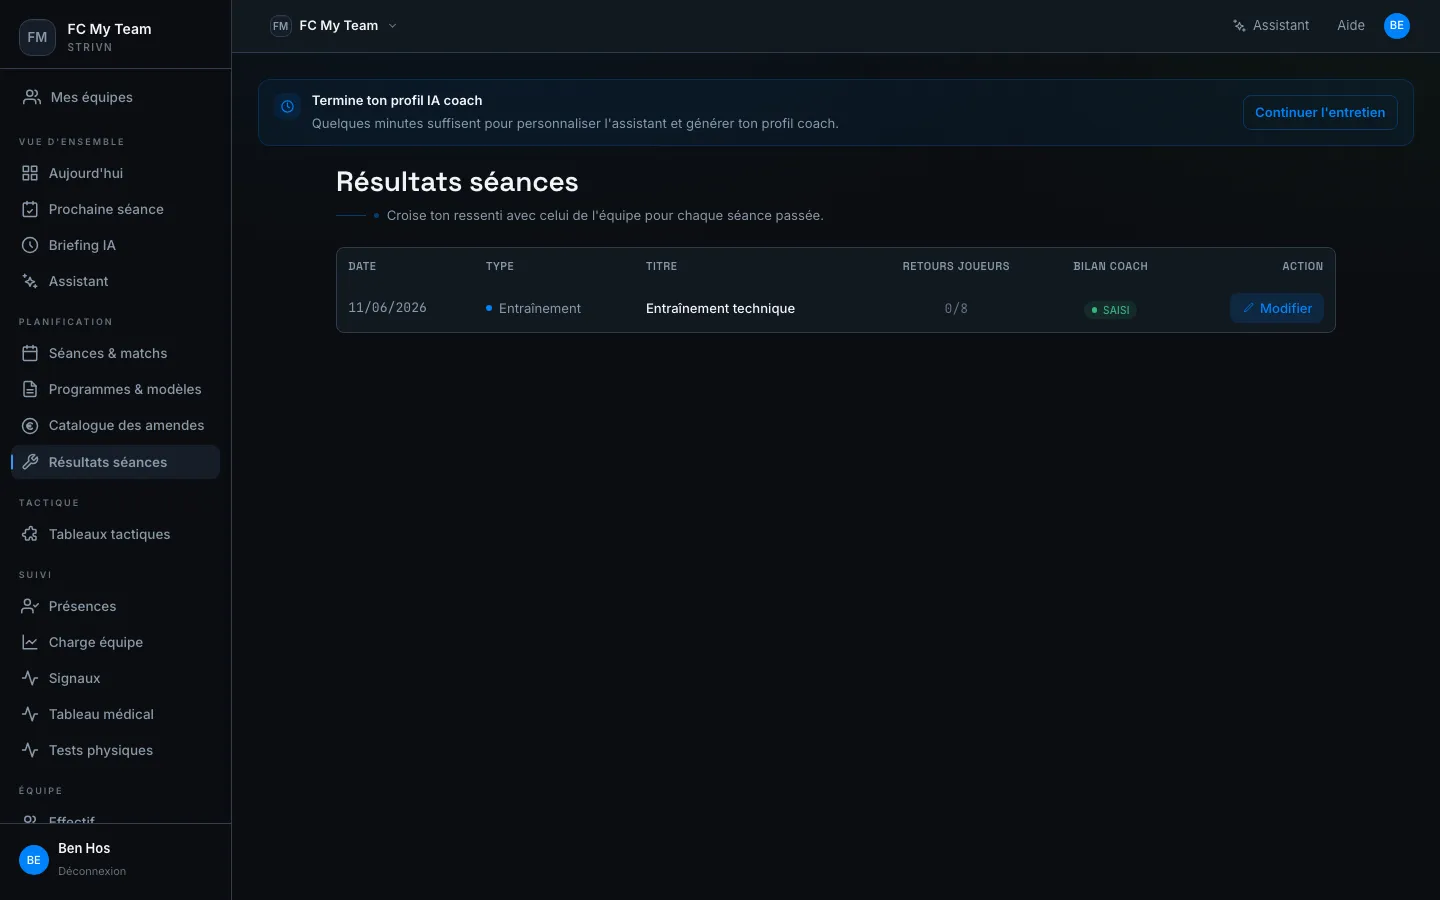
The list shows for each past event:
| Column | Description |
|---|---|
| DATE | Session date |
| TYPE | Training or Match |
| TITLE | Event title |
| PLAYER RESPONSES | Fraction of players who provided post-session feedback (0/8) |
| COACH REVIEW | ● ENTERED badge (green) if the review has been filled in, — otherwise |
| ACTION | Edit button to open the form |
Fill in the session review
Section titled “Fill in the session review”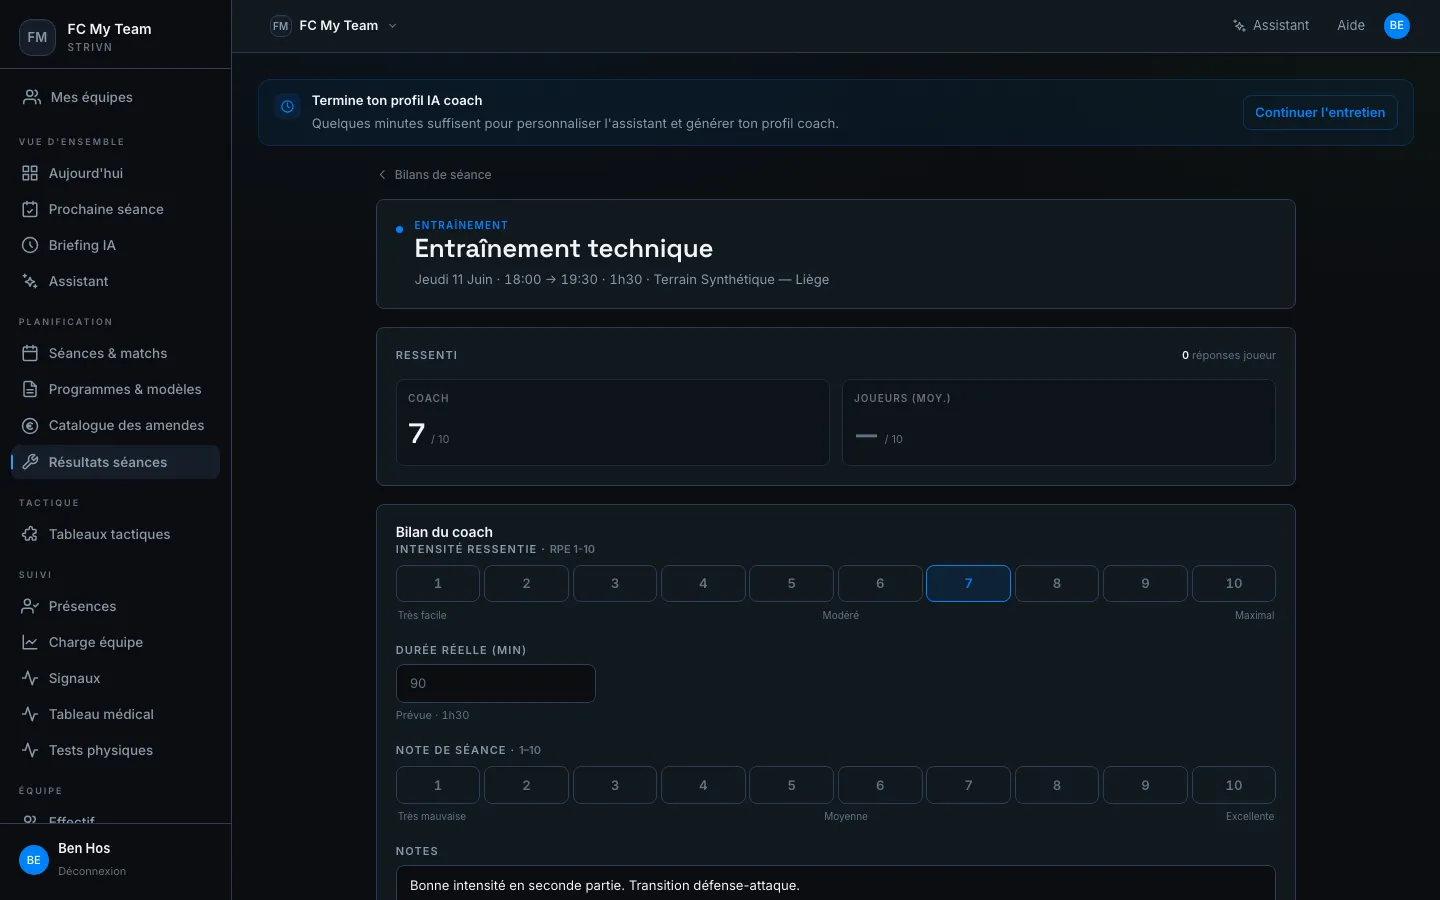
| Field | Description |
|---|---|
| PERCEIVED EXERTION · RPE 1-10 | Perceived load of the session (1 = very easy, 10 = maximum) |
| ACTUAL DURATION (min) | Actual duration in minutes — the planned duration is shown for reference |
| SESSION RATING · 1-10 | Overall quality (1 = very poor, 10 = excellent) |
| NOTES | Free-text field: content, intensity, incidents, tactical points |
Rating RPE with decimals
Section titled “Rating RPE with decimals”By default, perceived exertion is picked from ten buttons — a whole number from 1 to 10. If your strength & conditioning staff need finer grain, the team can switch to a decimal scale: the buttons give way to a free field where you type the value, with up to two decimals (for example 4.17).
To turn it on: Settings → General tab → Coach session RPE card → tick Rate RPE with decimals → Save.
The setting applies to the whole team and to every surface where you enter a session RPE: the session review, the Review panel on the next session, the shared dressing-room link, and the voice-debrief review screen.
Cross-reference with players
Section titled “Cross-reference with players”The FEELING section at the top of the form compares:
- COACH: your entered RPE
- PLAYERS (AVG.): average of the RPEs declared in post-session check-ins
A significant gap (e.g. coach: 7, players: 9) signals that the session was perceived differently — a signal worth investigating.
By default, players give their RPE at the next day’s check-in. For a faster, more complete response, enable Ask for feedback after the session when creating the event (see Calendar & events): present players then get a direct request about an hour after it ends, by push, WhatsApp or email.
Statistics tab
Section titled “Statistics tab”The Session results page has two tabs: Sessions (the list above) and Statistics, an aggregated read of your whole review history — with nothing extra to fill in.
Choose the period and type
Section titled “Choose the period and type”Two filters at the top of the tab drive every chart:
- Period: 4 wks, 8 wks (default), 12 wks, Season (if the team’s season dates are configured) or Custom (a date range of your choice).
- Type: All, Training (default), Matches, Recovery.
Key figures
Section titled “Key figures”A banner sums up the period. Each card also shows the change versus the equivalent previous period:
| Metric | Description |
|---|---|
| Sessions | Number of sessions over the period |
| Average rating | Average session rating (over rated sessions) |
| Intensity (coach RPE) | Average of the RPE you entered |
| Player RPE | Average of the RPEs players reported |
| Coach/player gap | Difference between the player RPE and yours |
| Average duration | Average actual session duration |
| Attendance | Share of players present across evaluated sessions |
| Reviews filled | Share of sessions whose review was filled in |
The charts
Section titled “The charts”- Weekly evolution — average rating and intensity, week by week. Weeks with no rated session stay empty (the line does not bridge them, to avoid suggesting a false trend).
- Weekday profile — the average rating for Monday, Tuesday… to spot recurring patterns. Days with fewer than two sessions are dimmed.
- Breakdown by type — a table comparing Training, Matches and Recovery on rating, intensity and volume.
By player
Section titled “By player”Pick a player from the dropdown — or click View evolution from the Player ranking — to display:
- the evolution chart of their individual rating and RPE over time;
- the player ranking for the team over the period, sorted by descending average rating.
Key takeaways
Section titled “Key takeaways”When the number of sessions allows, the Key takeaways area surfaces 1 to 3 automatic insights — for example “Monday sessions are rated 1.8 pts below average” or “the rating has been dropping for 3 weeks”. Turning the numbers into a decision.
Complete loop
Section titled “Complete loop”Check-in → signals before session → adjusted session → session review → better risk reading the next day.
Analysing a match’s goals
Section titled “Analysing a match’s goals”On a match review, the Goal review card opens the screen that walks each goal, scored and conceded alike, to qualify it and attribute the roles.
➡️ See Goal review.